Notes
- Jupyter Notebook: create_pivot_table-with_win32com.ipynb
- This implementation is for Windows systems with Excel and Python 3.6 or greater.
- Tested in python 3.12.0, and Microsoft® Excel® for Microsoft 365 MSO (Version 2403 Build 16.0.17425.20124) 64-bit
- The most helpful way to figure out the proper Excel methods to use, is record a step-by-step Macro in Excel, while creating a pivot table in the form you want.
- This code is most useful for creating a pivot table that has to be run on a routine basis in a file with existing data.
Summary
The document provides a detailed guide on how to create a pivot table in Excel using the Python win32com module. It includes a step-by-step guide, complete with Python code snippets and Visual Basic code for reference. The guide is designed for Windows systems with Excel and Python 3.6 or greater.
The document starts with an overview of the data and the desired pivot table. It then provides Python code for importing necessary modules, creating synthetic data, creating the pivot table, and running the Excel com object. The document also includes a main function to call other functions.
The document also provides a Visual Basic code recorded while manually creating the pivot table. This includes code for selecting source data, adding a pivot table, selecting a worksheet, renaming it, selecting cells, selecting a range, creating filters, creating columns, creating rows, and creating values.
The document ends with a list of resources for further reading and learning.
Excel Data & Pivot Table
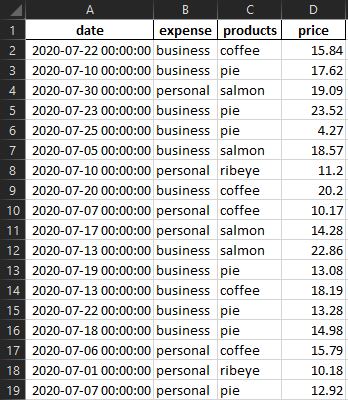
- The example data is in the following long form
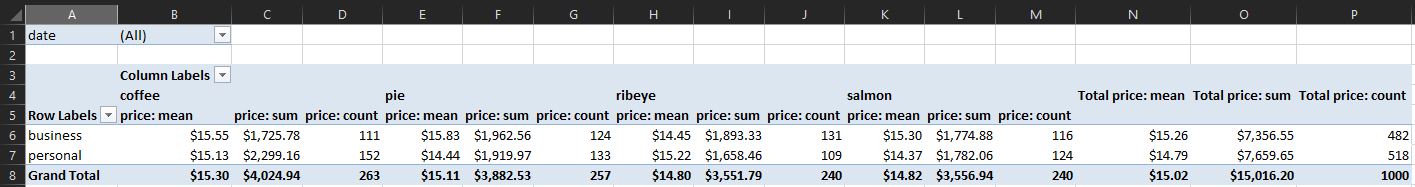
- The goal is to implement a python script to create the following Pivot Table
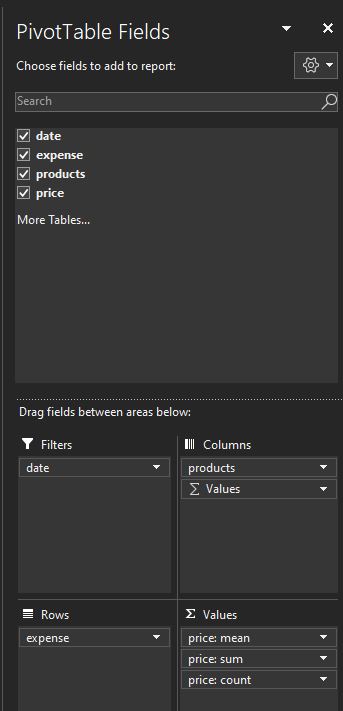
- These are the Pivot Table Fields
Python Code
Imports
1
2
3
4
5
6
7
8
9
10
| import win32com.client as win32
from pywintypes import com_error
from pathlib import Path
import sys
import pandas as pd # only used for synthetic data
import numpy as np # only used for synthetic data
import random # only used for synthetic data
from datetime import datetime # only used for synthetic data
win32c = win32.constants
|
Function to create synthetic data
- This function is only required to create the test data
1
2
3
4
5
6
7
8
9
10
11
12
13
14
15
16
17
| def create_test_excel_file(f_path: Path, f_name: str, sheet_name: str):
filename = f_path / f_name
random.seed(365)
np.random.seed(365)
number_of_data_rows = 1000
# create list of 31 dates
dates = pd.bdate_range(datetime(2020, 7, 1), freq='1d', periods=31).tolist()
data = {'date': [random.choice(dates) for _ in range(number_of_data_rows)],
'expense': [random.choice(['business', 'personal']) for _ in range(number_of_data_rows)],
'products': [random.choice(['ribeye', 'coffee', 'salmon', 'pie']) for _ in range(number_of_data_rows)],
'price': np.random.normal(15, 5, size=(1, number_of_data_rows))[0]}
# create the dataframe and save it to Excel
pd.DataFrame(data).to_excel(filename, index=False, sheet_name=sheet_name, float_format='%.2f')
|
Function to create the pivot table
1
2
3
4
5
6
7
8
9
10
11
12
13
14
15
16
17
18
19
20
21
22
23
24
25
26
27
28
29
30
31
32
33
34
35
36
| def pivot_table(wb: object, ws1: object, pt_ws: object, ws_name: str, pt_name: str, pt_rows: list, pt_cols: list, pt_filters: list, pt_fields: list):
"""
wb = workbook1 reference
ws1 = worksheet1
pt_ws = pivot table worksheet number
ws_name = pivot table worksheet name
pt_name = name given to pivot table
pt_rows, pt_cols, pt_filters, pt_fields: values selected for filling the pivot tables
"""
# pivot table location
pt_loc = len(pt_filters) + 2
# grab the pivot table source data
pc = wb.PivotCaches().Create(SourceType=win32c.xlDatabase, SourceData=ws1.UsedRange)
# create the pivot table object
pc.CreatePivotTable(TableDestination=f'{ws_name}!R{pt_loc}C1', TableName=pt_name)
# selecte the pivot table work sheet and location to create the pivot table
pt_ws.Select()
pt_ws.Cells(pt_loc, 1).Select()
# Sets the rows, columns and filters of the pivot table
for field_list, field_r in ((pt_filters, win32c.xlPageField), (pt_rows, win32c.xlRowField), (pt_cols, win32c.xlColumnField)):
for i, value in enumerate(field_list):
pt_ws.PivotTables(pt_name).PivotFields(value).Orientation = field_r
pt_ws.PivotTables(pt_name).PivotFields(value).Position = i + 1
# Sets the Values of the pivot table
for field in pt_fields:
pt_ws.PivotTables(pt_name).AddDataField(pt_ws.PivotTables(pt_name).PivotFields(field[0]), field[1], field[2]).NumberFormat = field[3]
# Visiblity True or Valse
pt_ws.PivotTables(pt_name).ShowValuesRow = True
pt_ws.PivotTables(pt_name).ColumnGrand = True
|
- To modify this code for a new data file, update:
ws1ws2_namept_namept_rowspt_colspt_filterspt_fields
1
2
3
4
5
6
7
8
9
10
11
12
13
14
15
16
17
18
19
20
21
22
23
24
25
26
27
28
29
30
31
32
33
34
35
36
37
38
39
40
41
| def run_excel(f_path: Path, f_name: str, sheet_name: str):
filename = f_path / f_name
# create excel object
excel = win32.gencache.EnsureDispatch('Excel.Application')
# excel can be visible or not
excel.Visible = True # False
# try except for file / path
try:
wb = excel.Workbooks.Open(filename)
except com_error as e:
if e.excepinfo[5] == -2146827284:
print(f'Failed to open spreadsheet. Invalid filename or location: {filename}')
else:
raise e
sys.exit(1)
# set worksheet
ws1 = wb.Sheets('data')
# Setup and call pivot_table
ws2_name = 'pivot_table'
wb.Sheets.Add().Name = ws2_name
ws2 = wb.Sheets(ws2_name)
pt_name = 'example' # must be a string
pt_rows = ['expense'] # must be a list
pt_cols = ['products'] # must be a list
pt_filters = ['date'] # must be a list
# [0]: field name [1]: pivot table column name [3]: calulation method [4]: number format
pt_fields = [['price', 'price: mean', win32c.xlAverage, '$#,##0.00'], # must be a list of lists
['price', 'price: sum', win32c.xlSum, '$#,##0.00'],
['price', 'price: count', win32c.xlCount, '0']]
pivot_table(wb, ws1, ws2, ws2_name, pt_name, pt_rows, pt_cols, pt_filters, pt_fields)
# wb.Close(True)
# excel.Quit()
|
Main function to call other functions
- To modify this code for a new data file, update:
sheet_namef_pathf_name- Remove
create_test_excel_file
1
2
3
4
5
6
7
8
9
10
11
12
| def main():
# sheet name for data
sheet_name = 'data' # update with sheet name from your file
# file path
f_path = Path.cwd() # file in current working directory
# f_path = Path(r'c:\...\Documents') # file located somewhere else
# excel file
f_name = 'test.xlsx'
# function calls
create_test_excel_file(f_path, f_name, sheet_name) # remove when running your own file
run_excel(f_path, f_name, sheet_name)
|
Call def main
Visual Basic
- Following is the visual basic code recorded while manually creating the pivot table
Select Source Data
Range("A1:D1").Select
Range(Selection, Selection.End(xlDown)).Select
Add Pivot Table
Sheets.Add
ActiveWorkbook.PivotCaches.Create(SourceType:=xlDatabase, SourceData:= _
    "data!R1C1:R1001C4", Version:=6).CreatePivotTable TableDestination:= _
    "Sheet1!R3C1", TableName:="PivotTable1", DefaultVersion:=6
Select Worksheet, Rename, Select Cells, Select Range
Sheets("Sheet1").Select
Sheets("Sheet1").Name = "pivot_table"
Cells(3, 1).Select
Range("A3").Select
Create Filters
With ActiveSheet.PivotTables("PivotTable1").PivotFields("date")
    .Orientation = xlPageField
    .Position = 1
Create Columns
With ActiveSheet.PivotTables("PivotTable1").PivotFields("products")
    .Orientation = xlColumnField
    .Position = 1
Create Rows
With ActiveSheet.PivotTables("PivotTable1").PivotFields("expense")
    .Orientation = xlRowField
    .Position = 1
Create Values
Price Sum
ActiveSheet.PivotTables("PivotTable1").AddDataField ActiveSheet.PivotTables( _
    "PivotTable1").PivotFields("price"), "Sum of price", xlSum
With ActiveSheet.PivotTables("PivotTable1").PivotFields("Sum of price")
    .Caption = "price: sum"
    .NumberFormat = "$#,##0.00"
Price Mean
ActiveSheet.PivotTables("PivotTable1").AddDataField ActiveSheet.PivotTables( _
    "PivotTable1").PivotFields("price"), "Sum of price", xlSum
With ActiveSheet.PivotTables("PivotTable1").PivotFields("Sum of price")
    .Caption = "price: mean"
    .Function = xlAverage
    .NumberFormat = "$#,##0.00"
Price Count
ActiveSheet.PivotTables("PivotTable1").AddDataField ActiveSheet.PivotTables( _
    "PivotTable1").PivotFields("price"), "Sum of price", xlSum
With ActiveSheet.PivotTables("PivotTable1").PivotFields("Sum of price")
    .Caption = "price: count"
    .Function = xlCount
    .NumberFormat = "0"
Resources